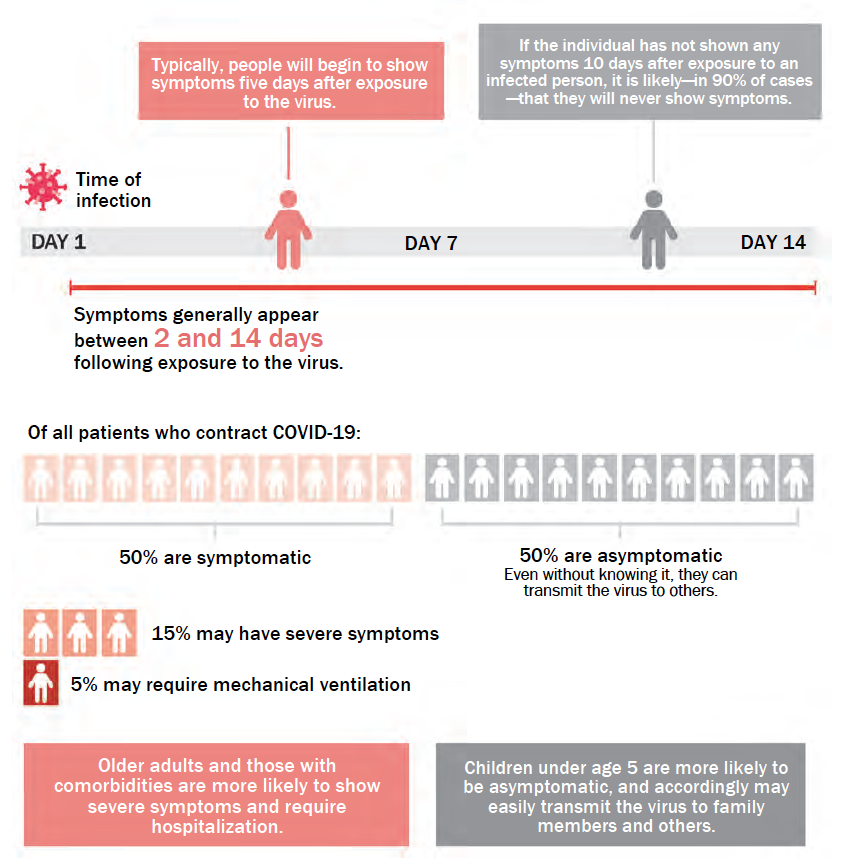
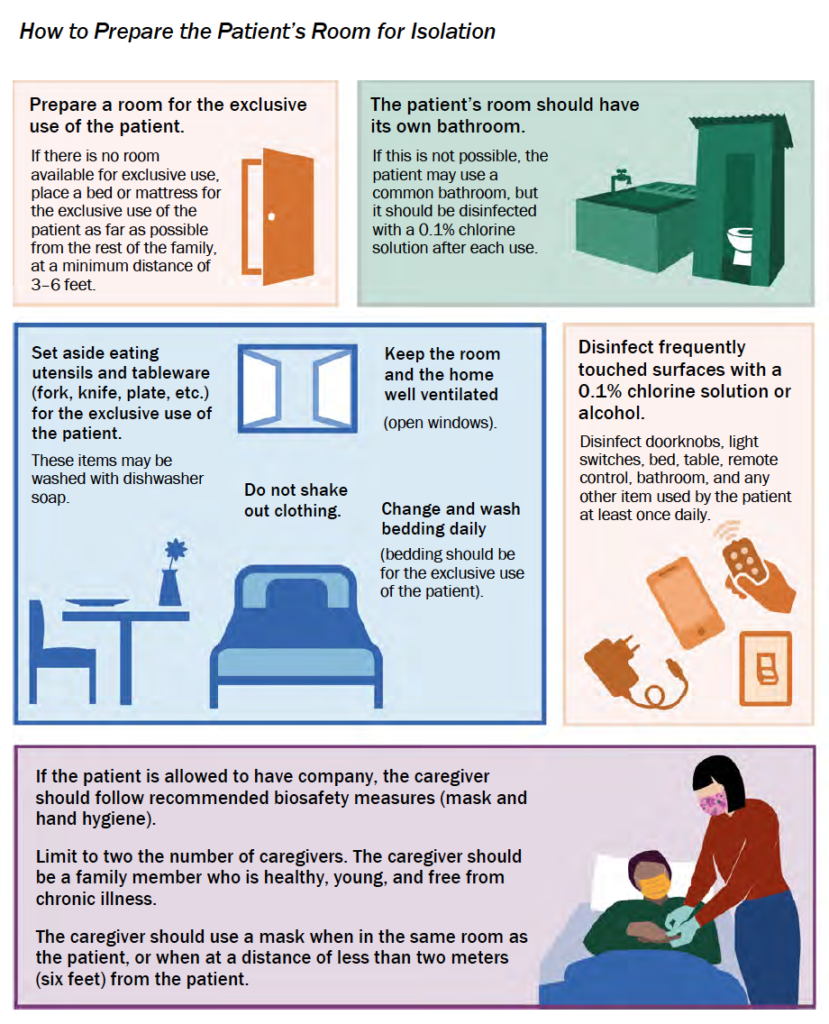
Selected original infographics from the COVID-19 Home Care Guide developed with HP+.
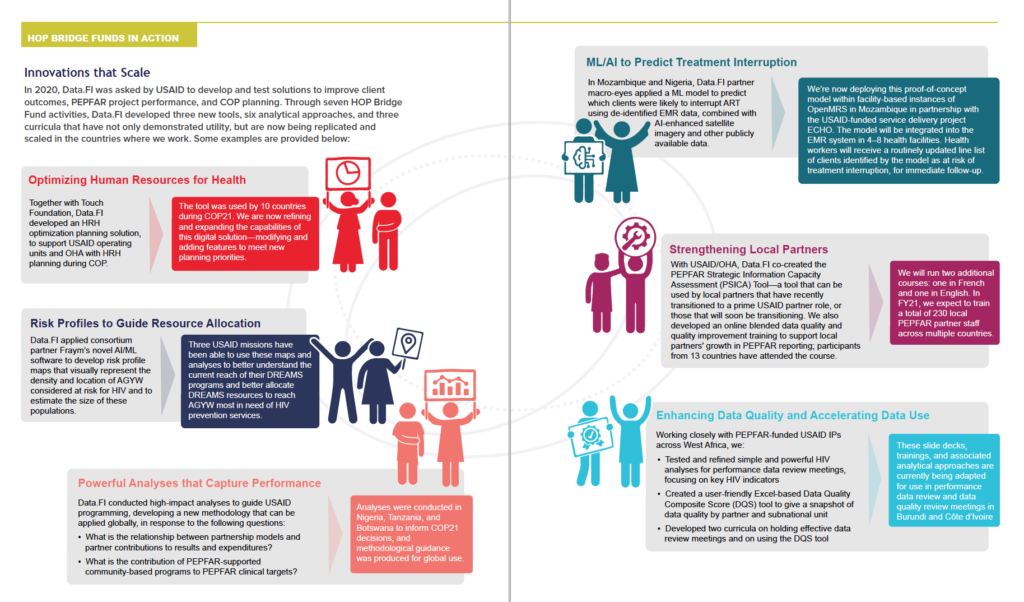
Graphic spread from Data.FI Semi Annual Performance Report, April 2021.
Select
Gwendolyn Stinger | Design Consultant
Health and development, made visual.
Selected original infographics from the COVID-19 Home Care Guide developed with HP+.
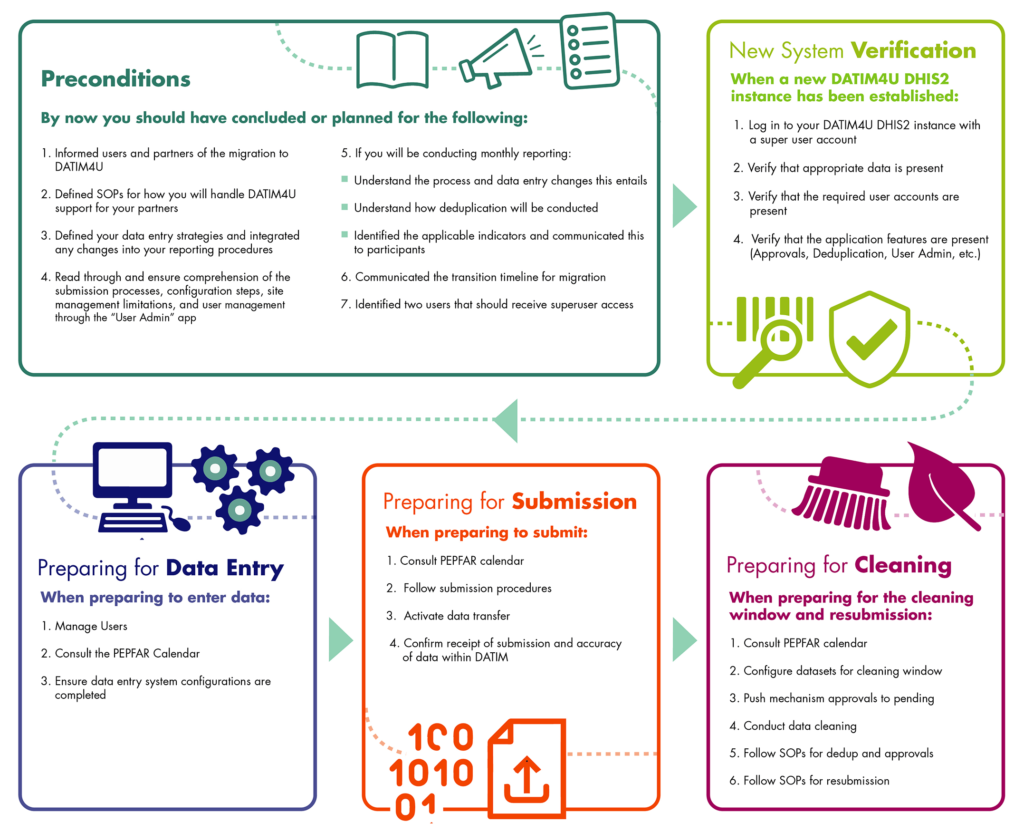
Graphic spread from Data.FI Semi Annual Performance Report, April 2021.
Select